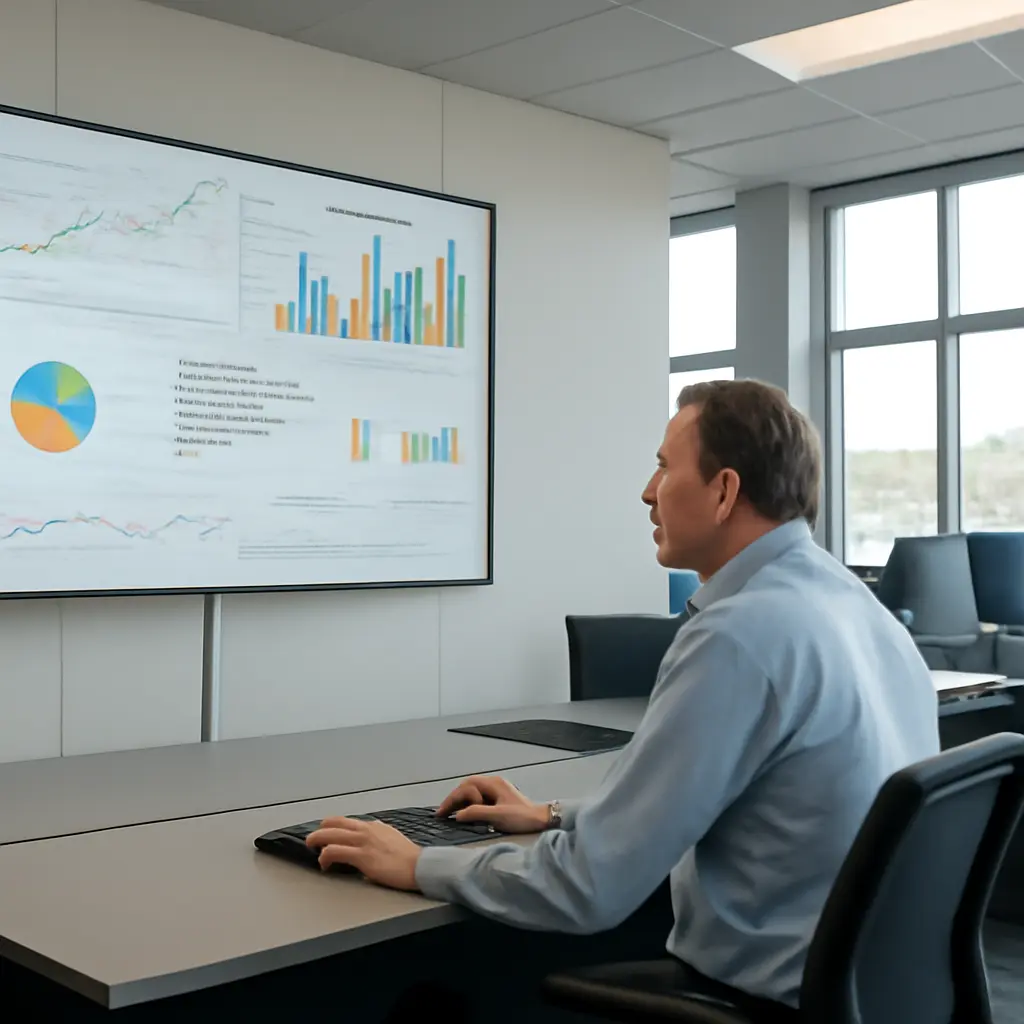
An instant dashboard is a continuously refreshed visual display of operational or business data, designed to help people see what is happening and act without waiting for a periodic report. Its value is not simply speed: a well-designed dashboard turns live signals into shared visibility, early warnings, and more timely decisions. That matters as organizations face fast-moving customer, financial, and operational conditions. A 2023 survey by the business-analytics firm Qlik, conducted with the University of Oxford’s Saïd Business School, found that 67% of surveyed employees said they were uncomfortable accessing or using data. Instant dashboards can make important measures easier to find, but they reveal problems only when the data is reliable, the metrics are meaningful, and someone is responsible for responding.
Instant Dashboard Data Reveals Operational Signals
Dashboard data is the set of selected measures presented in visual form to support monitoring, analysis, or decisions. The U.S. Government Accountability Office describes a dashboard as a visual display of key information needed to achieve one or more objectives, consolidated and arranged on a single screen. “Instant” is best understood as a design goal—not a promise that every underlying system updates at the same moment. Refresh frequency depends on data sources, processing, and business requirements.
A dashboard’s central attribute is visibility: it brings status, change, and exceptions into view. Common forms include operational dashboards for near-term work, analytical dashboards for exploring patterns, and strategic dashboards for tracking longer-term goals. Their shared purpose is to connect measures to a question, such as whether orders are being fulfilled on time or whether customer wait times are rising.
Operational dashboards expose current conditions
An operational dashboard tracks activities that may require prompt attention, such as inventory levels, service queues, production output, or system availability. It can reveal an emerging bottleneck by showing a current value beside a target or threshold. For example, a fulfillment team might see orders awaiting packing, average processing time, and overdue shipments together. The display helps locate pressure points; it does not, by itself, explain their cause.
Analytical dashboards reveal patterns and relationships
An analytical dashboard helps users compare performance across time, locations, products, or customer groups. Filters and historical views can show whether a change is isolated or part of a larger trend. This distinction matters because a single live reading can be noisy: a brief spike may not indicate a persistent issue. Pairing current metrics with historical baselines gives teams more context before they intervene.
Strategic dashboards connect activity to goals
A strategic dashboard presents a compact view of progress toward broader objectives, such as revenue growth, customer retention, or service quality. It commonly relies on key performance indicators (KPIs), which are selected measures linked to an organizational goal. The crucial test is relevance: a number belongs on the dashboard when its movement helps users understand progress or choose an action, not merely because it is easy to collect.
Dashboard Timeliness Reveals Changes, Not Certainty
Timeliness describes how soon data becomes available after the event it represents. In an instant dashboard, that interval may range from seconds to minutes—or longer if source systems update in batches. The U.S. Government Accountability Office’s guidance on data reliability emphasizes that data should be assessed for accuracy, completeness, and applicability to its intended use. A fresh display can still be misleading if its inputs are delayed, incomplete, or inconsistent.
Refresh rate should match the decision
Refresh rate is the interval at which dashboard data is updated. A logistics control room may need frequent updates to respond to disruptions, while a monthly financial review may not benefit from second-by-second refreshes. Faster refresh can also increase infrastructure costs and create distracting fluctuations. Teams should set the update interval according to how quickly the underlying condition changes and how quickly users can realistically act.
Data quality determines whether a signal is trustworthy
Data quality concerns whether information is accurate, complete, consistent, and fit for its stated purpose. Dashboards should identify the reporting period, source, and last refresh time so users can distinguish current readings from stale ones. Definitions also need to be consistent: if two teams calculate “active customer” differently, a shared chart can create disagreement rather than alignment. Validation rules, reconciliation checks, and named data owners help make displayed metrics dependable.
Context separates meaningful movement from noise
Context gives a data point a frame of reference, such as a target, prior period, expected range, or relevant segment. A 10% increase may be good for sales but alarming for defect rates. The U.S. Bureau of Labor Statistics’ guidance on interpreting data series similarly underscores the importance of definitions, time periods, and measurement context when comparing figures. Dashboards should label units and comparisons clearly, and avoid implying that two measures are causally related merely because they move together.
Dashboard Design Reveals What Deserves Attention
Dashboard design is the selection and arrangement of information so users can understand it accurately and efficiently. The U.S. Government Accountability Office recommends designing dashboards around clear objectives and useful information rather than treating them as collections of charts. A practical dashboard makes the important measures prominent, explains their meaning, and distinguishes routine variation from conditions that call for action.
KPI selection turns goals into observable measures
A KPI is a measurable indicator used to assess progress toward a defined objective. Strong KPIs have clear definitions, a meaningful owner, and an associated target or decision. For example, a customer-support team might track both resolution time and customer satisfaction: focusing on speed alone could encourage rushed responses. A balanced set of measures makes trade-offs visible and reduces the risk of optimizing one number at the expense of the overall outcome.
Visual hierarchy helps users find exceptions
Visual hierarchy uses position, size, labels, and restrained color to guide attention. A dashboard should make critical exceptions easy to spot while preserving enough context to interpret them. The U.S. Census Bureau’s data-visualization guidance recommends clear titles, labels, and appropriate chart choices so viewers can understand what a graphic represents. For instance, a line chart is generally more suitable for change over time than a pie chart, which is intended to show parts of a whole.
Alerts connect visibility to a response
An alert is a notification triggered when a measure crosses a defined condition. Useful alerts identify the metric, threshold, severity, and expected next step; poorly calibrated alerts can create fatigue and be ignored. Organizations should review alert volume and outcomes, then adjust thresholds when users receive too many false alarms or miss important events. A dashboard becomes operationally useful when its signals are connected to an agreed response, not simply displayed.
Dashboard Use Reveals Organizational Readiness
Dashboard use is the organizational practice of interpreting shared measures and acting on them. Data access alone does not guarantee data-informed decisions. In the 2023 Qlik and Oxford Saïd report, 67% of surveyed employees said they were uncomfortable accessing or using data. The finding points to a skills and confidence challenge: dashboards need to be accompanied by understandable definitions, training, and clear decision rights.
Shared definitions create a common operating picture
A common operating picture is a shared view of relevant conditions used by people coordinating work. Dashboards can support one by putting teams’ agreed measures in a consistent place. To make that view credible, organizations should document how metrics are calculated, who owns them, and when they refresh. This is particularly important when data is combined from separate systems or departments.
Access and governance protect responsible use
Data governance defines responsibilities and rules for managing information, including access, quality, privacy, and retention. Dashboards may expose sensitive customer, employee, or commercial information, so access should be limited to legitimate needs. The National Institute of Standards and Technology’s Privacy Framework provides a risk-based approach organizations can use to identify and manage privacy risks. Governance should also clarify who can change metric definitions and how corrections to source data are communicated.
Real-world example: monitoring public health
Public-health dashboards illustrate both the usefulness and limits of near-current reporting. During the COVID-19 pandemic, agencies and researchers used dashboards to track reported cases, hospital indicators, and vaccination activity. The U.S. Centers for Disease Control and Prevention cautioned that surveillance data can be affected by reporting delays and changes in testing or reporting practices. A visible trend therefore needs metadata and caveats: users must know what is counted, when it was reported, and whether the measure remains comparable over time.
Conclusion: Instant Dashboard Data Reveals Signals That Require Judgment
Instant dashboards reveal operational signals, changing patterns, progress toward goals, and exceptions that may need attention. Their usefulness depends on more than refresh speed: timeliness must match the decision, data quality must be assessed, and design must provide context. KPIs, visual hierarchy, and alerts can focus attention, while governance, shared definitions, and user confidence make action more consistent.
Organizations should begin with the decisions users need to make, select only the measures that support those decisions, and document each measure’s source, owner, and refresh schedule. Then test whether users interpret the display correctly and whether alerts lead to useful responses. A dashboard should be treated as a decision-support tool—not a substitute for expertise, investigation, or sound judgment.
Sources: U.S. Government Accountability Office, Designing Evaluations: 2012 Revision, https://www.gao.gov/products/gao-12-208g; U.S. Government Accountability Office, Assessing the Reliability of Computer-Processed Data, https://www.gao.gov/products/gao-09-680g; Qlik and University of Oxford Saïd Business School, The Data Literacy Index, https://www.qlik.com/us/resource-library/data-literacy-index; U.S. Bureau of Labor Statistics, Handbook of Methods, https://www.bls.gov/opub/hom/; U.S. Census Bureau, Data Visualization, https://www.census.gov/data/what-is-data-census-gov/guidance-for-data-users/data-visualization.html; National Institute of Standards and Technology, NIST Privacy Framework, https://www.nist.gov/privacy-framework; U.S. Centers for Disease Control and Prevention, COVID Data Tracker, https://covid.cdc.gov/covid-data-tracker/